SHARE THIS ARTICLE
CASE STUDIES
Acoustic Sand Monitoring and Online Sand Sampling in the Natuna Sea
Location: Southeast Asia
Industry: Oil & Gas
Loss of Primary Containment (LOPC) is a serious safety and asset-integrity concern on offshore oil and gas platforms. Sand production can accelerate erosion, damage surface equipment and pipework, and increase the risk of containment failure. Reliable sand-production surveillance is therefore essential for protecting both topside and subsea infrastructure.
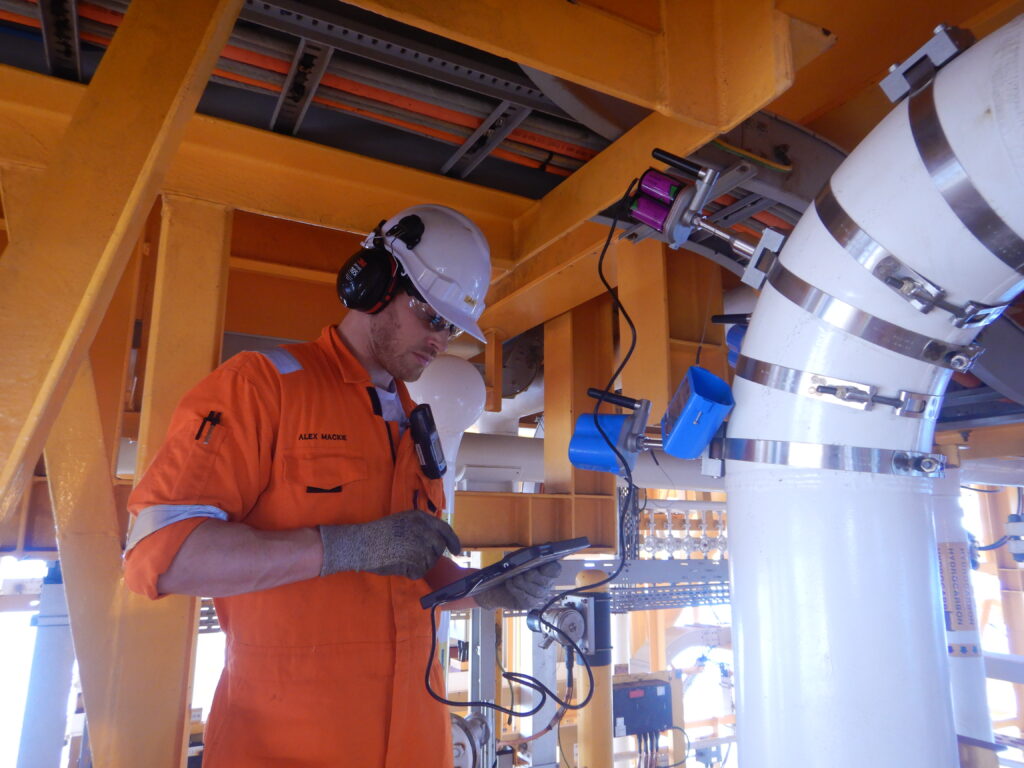
In this case study, we deployed temporary Acoustic Sand Monitoring (ASM) and Online Sand Sampling (OSS) on a client’s production platform in the Natuna Sea. The platform was located approximately 250 km northeast of Indonesia’s Riau Islands and around 600 km from Singapore.
The campaign was designed to help the operator understand the sanding behaviour of individual wells, identify wells with higher sand-production potential, and validate acoustic trends using physical sand samples. The resulting data gave the client a stronger basis for managing production and protecting critical equipment.
The challenge
The operator had experienced significant sand production, resulting in damage to surface equipment and pipework. A series of LOPC incidents increased the urgency of improving sand management.
At the time, the platform did not have an in-situ sand-monitoring system. The operator was therefore relying on conventional spot sampling, which could miss or underestimate transient sand-production events. Using only one monitoring method also created uncertainty when interpreting the data and assessing erosion risks.
The urgent nature of the callout introduced further challenges:
- No advance site survey was available.
- There was no historical Particle Size Distribution (PSD) data for sand passing through the surface handling equipment.
- Several wells had low flow rates, making acoustic detection less effective.
- Real-time flow-velocity data was not available to support interpretation of the ASM results.
- Background process noise made it more difficult to distinguish acoustic responses caused by sand impacts.
- The temporary ASM setup had not undergone controlled sand-injection calibration, so it could indicate sanding trends but could not reliably produce quantitative sand-rate measurements.
The monitoring approach
The team used ASM and OSS together to provide a more complete picture of sand production across the wells.
ASM was used to monitor changes in acoustic activity, flow behaviour, and sanding trends at different flow rates. During the campaign, the system also identified distinct patterns associated with slugging flow. These patterns were important because prolonged slugging may increase the likelihood of sand carryover through the production system.
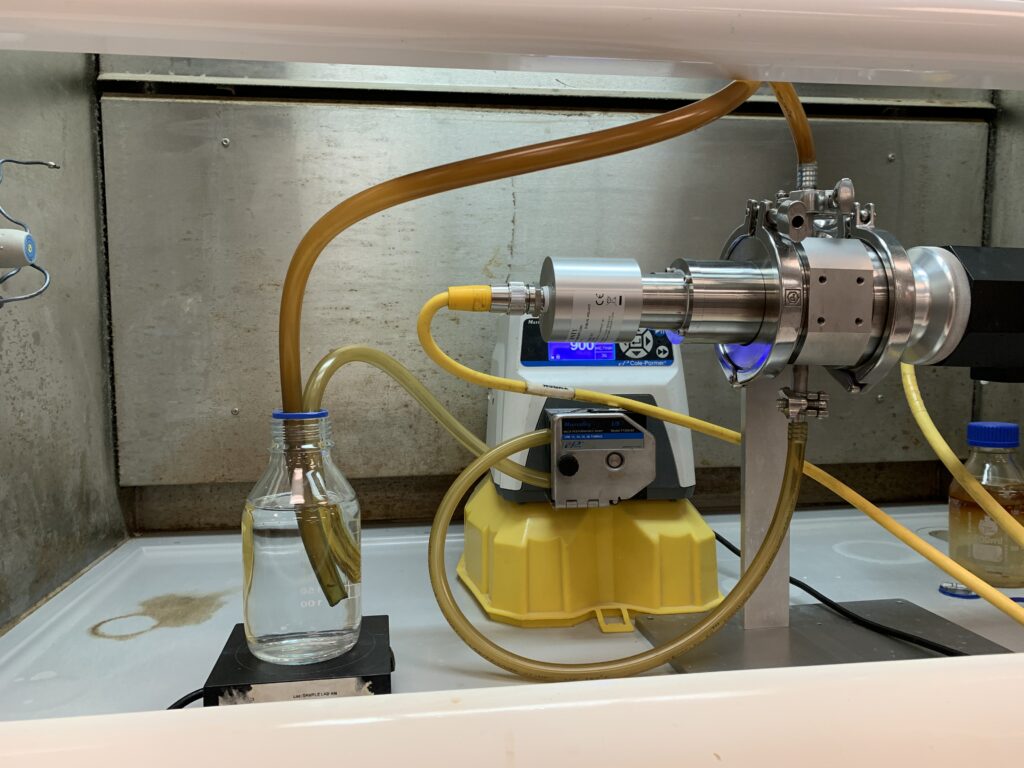
OSS was used to collect physical sand samples through filters with different mesh sizes. The samples were sent to a laboratory for further examination, including PSD analysis. This provided direct information about the sand being transported through the surface equipment.
OSS was particularly valuable for wells with flow rates too low for dependable ASM detection. However, physical sampling alone may not capture the timing or behaviour of transient sanding events. ASM helped address this limitation by providing continuous trend information over the monitoring period.
Used together, the two methods provided complementary information:
- ASM showed when sanding activity changed and how it related to flow behaviour.
- OSS confirmed the physical presence of sand and supported particle analysis.
- Combined results improved confidence in the interpretation of well performance and sand-production risk.
Results
The campaign gave the operator a clearer understanding of sanding behaviour across the tested wells and flow conditions.
Several wells were identified as high sand producers and shortlisted for closer attention. Other wells were considered suitable for continuous production within the tested flow-rate range, provided that the flow regime remained stable and no significant operating changes occurred.
The campaign also provided visibility of:
- Well sanding tendencies.
- Flow behaviour and changes in sanding activity.
- Well clean-up durations.
- Critical drawdown conditions.
- Maximum Sand-Free Rates (MSFR).
- Sand particle characteristics based on laboratory PSD analysis.
This information enabled the operator to distinguish wells requiring additional sand-management attention from those that could be produced with greater confidence under the assessed conditions.
Recommendations
To strengthen future analysis, we recommends integrating real-time pressure, temperature, and flow data from the platform’s Distributed Control System (DCS) or PI System with the sand-monitoring results.
Combining process data with ASM and OSS outputs would make it easier to relate sanding events to changes in well and production conditions. It would also support more consistent analysis of drawdown, flow regime, clean-up behaviour, and production limits.
A multidisciplinary onshore sand-management review is also recommended. The review should involve relevant production, reservoir, wells, facilities, operations, and integrity personnel. This would help the client identify gaps in current workflows, improve data use, and define practical measures for long-term sand management.
Improving sand-management decisions
The combined monitoring campaign helped the operator make better-informed sand-management and production decisions.
With ASM and OSS working together, the client could:
- Reduce uncertainty caused by relying on a single monitoring method.
- Identify high sand-producing wells for targeted maintenance and surveillance.
- Improve confidence when assessing production within tested flow-rate limits.
- Optimise production toward the Maximum Sand-Free Rate while protecting equipment.
- Establish a consistent reference point for future monitoring campaigns.
- Build a stronger foundation for long-term sand-management planning.
Loss of Primary Containment (LOPC) is a serious safety and asset-integrity concern on offshore oil and gas platforms. Sand production can accelerate erosion, damage surface equipment and pipework, and increase the risk of containment failure. Reliable sand-production surveillance is therefore essential for protecting both topside and subsea infrastructure.
In this case study, we deployed temporary Acoustic Sand Monitoring (ASM) and Online Sand Sampling (OSS) on a client’s production platform in the Natuna Sea. The platform was located approximately 250 km northeast of Indonesia’s Riau Islands and around 600 km from Singapore.
The campaign was designed to help the operator understand the sanding behaviour of individual wells, identify wells with higher sand-production potential, and validate acoustic trends using physical sand samples. The resulting data gave the client a stronger basis for managing production and protecting critical equipment.
The challenge
The operator had experienced significant sand production, resulting in damage to surface equipment and pipework. A series of LOPC incidents increased the urgency of improving sand management.
At the time, the platform did not have an in-situ sand-monitoring system. The operator was therefore relying on conventional spot sampling, which could miss or underestimate transient sand-production events. Using only one monitoring method also created uncertainty when interpreting the data and assessing erosion risks.
The urgent nature of the callout introduced further challenges:
- No advance site survey was available.
- There was no historical Particle Size Distribution (PSD) data for sand passing through the surface handling equipment.
- Several wells had low flow rates, making acoustic detection less effective.
- Real-time flow-velocity data was not available to support interpretation of the ASM results.
- Background process noise made it more difficult to distinguish acoustic responses caused by sand impacts.
- The temporary ASM setup had not undergone controlled sand-injection calibration, so it could indicate sanding trends but could not reliably produce quantitative sand-rate measurements.
The monitoring approach
The team used ASM and OSS together to provide a more complete picture of sand production across the wells.
ASM was used to monitor changes in acoustic activity, flow behaviour, and sanding trends at different flow rates. During the campaign, the system also identified distinct patterns associated with slugging flow. These patterns were important because prolonged slugging may increase the likelihood of sand carryover through the production system.
OSS was used to collect physical sand samples through filters with different mesh sizes. The samples were sent to a laboratory for further examination, including PSD analysis. This provided direct information about the sand being transported through the surface equipment.
OSS was particularly valuable for wells with flow rates too low for dependable ASM detection. However, physical sampling alone may not capture the timing or behaviour of transient sanding events. ASM helped address this limitation by providing continuous trend information over the monitoring period.
Used together, the two methods provided complementary information:
- ASM showed when sanding activity changed and how it related to flow behaviour.
- OSS confirmed the physical presence of sand and supported particle analysis.
- Combined results improved confidence in the interpretation of well performance and sand-production risk.
Results
The campaign gave the operator a clearer understanding of sanding behaviour across the tested wells and flow conditions.
Several wells were identified as high sand producers and shortlisted for closer attention. Other wells were considered suitable for continuous production within the tested flow-rate range, provided that the flow regime remained stable and no significant operating changes occurred.
The campaign also provided visibility of:
- Well sanding tendencies.
- Flow behaviour and changes in sanding activity.
- Well clean-up durations.
- Critical drawdown conditions.
- Maximum Sand-Free Rates (MSFR).
- Sand particle characteristics based on laboratory PSD analysis.
This information enabled the operator to distinguish wells requiring additional sand-management attention from those that could be produced with greater confidence under the assessed conditions.
Recommendations
To strengthen future analysis, we recommends integrating real-time pressure, temperature, and flow data from the platform’s Distributed Control System (DCS) or PI System with the sand-monitoring results.
Combining process data with ASM and OSS outputs would make it easier to relate sanding events to changes in well and production conditions. It would also support more consistent analysis of drawdown, flow regime, clean-up behaviour, and production limits.
A multidisciplinary onshore sand-management review is also recommended. The review should involve relevant production, reservoir, wells, facilities, operations, and integrity personnel. This would help the client identify gaps in current workflows, improve data use, and define practical measures for long-term sand management.
Improving sand-management decisions
The combined monitoring campaign helped the operator make better-informed sand-management and production decisions.
With ASM and OSS working together, the client could:
- Reduce uncertainty caused by relying on a single monitoring method.
- Identify high sand-producing wells for targeted maintenance and surveillance.
- Improve confidence when assessing production within tested flow-rate limits.
- Optimise production toward the Maximum Sand-Free Rate while protecting equipment.
- Establish a consistent reference point for future monitoring campaigns.
- Build a stronger foundation for long-term sand-management planning.